
Analyzing crypto charts helps to identify new crypto market trends and predict the price movements of each asset. As a result, you make informed investment decisions, which is incredibly important. Read this guide to learn:
- What are crypto charts?
- Basic indicators in a crypto chart
- How to read cryptocurrency charts?
- How to analyze Bitcoin market?
- How to tell if a cryptocurrency will rise?
- FAQ
What Are Crypto Charts?
Crypto charts, also known as crypto technical analysis, are the art of studying and identifying the rise and fall of crypto coin prices and crypto market value along with its volume and momentum. The technical analysis is conducted to decide whether the market is bullish or bearish.
A bullish crypto market means the trading conditions are more favorable for investing. In contrast, the bearish crypto market means that asset prices are falling and as an investor, you must be worried about losing the profit on your investment.
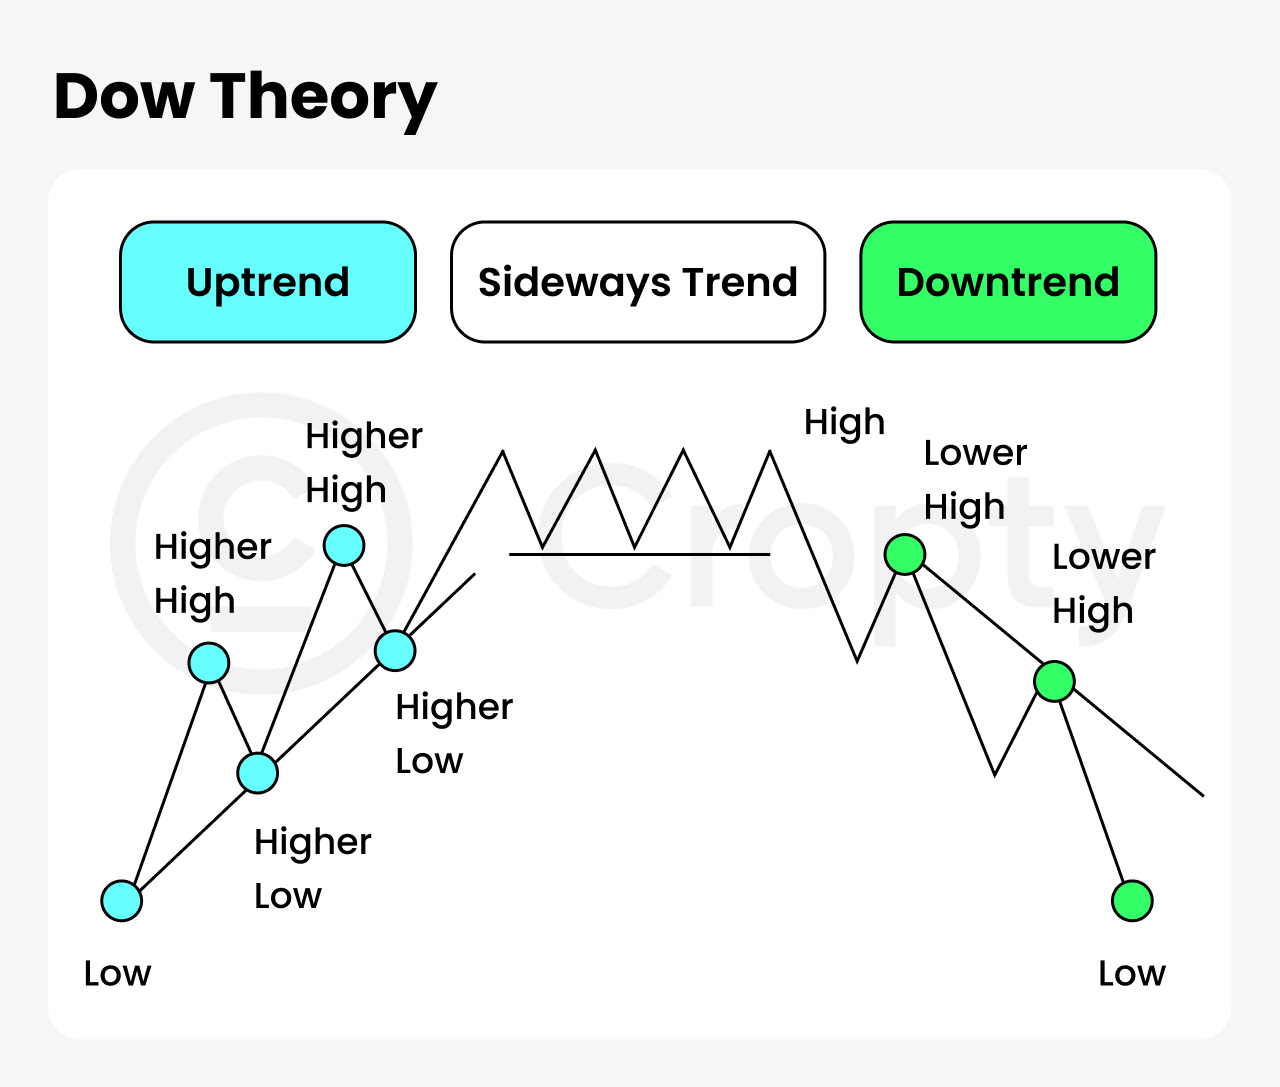
On most crypto charts, you can trace the wedges by drawing a line to connect the movement of lower points. You can draw another line to connect the price peaks, and if both lines reach each other (from left to right) this means the crypto market is bearish.
However, there are different types of crypto charts. When reading crypto charts, each one is interpreted differently.
Candlestick Chart Pattern
Japanese candlestick patterns create visual representations of financial data for traders and technical analysts. The patterns are studied through their appearance, representing how the asset’s price swings between bullish and bearish crypto markets. The patterns predict the assets’ future behavior and can also represent movement on various timeframes.
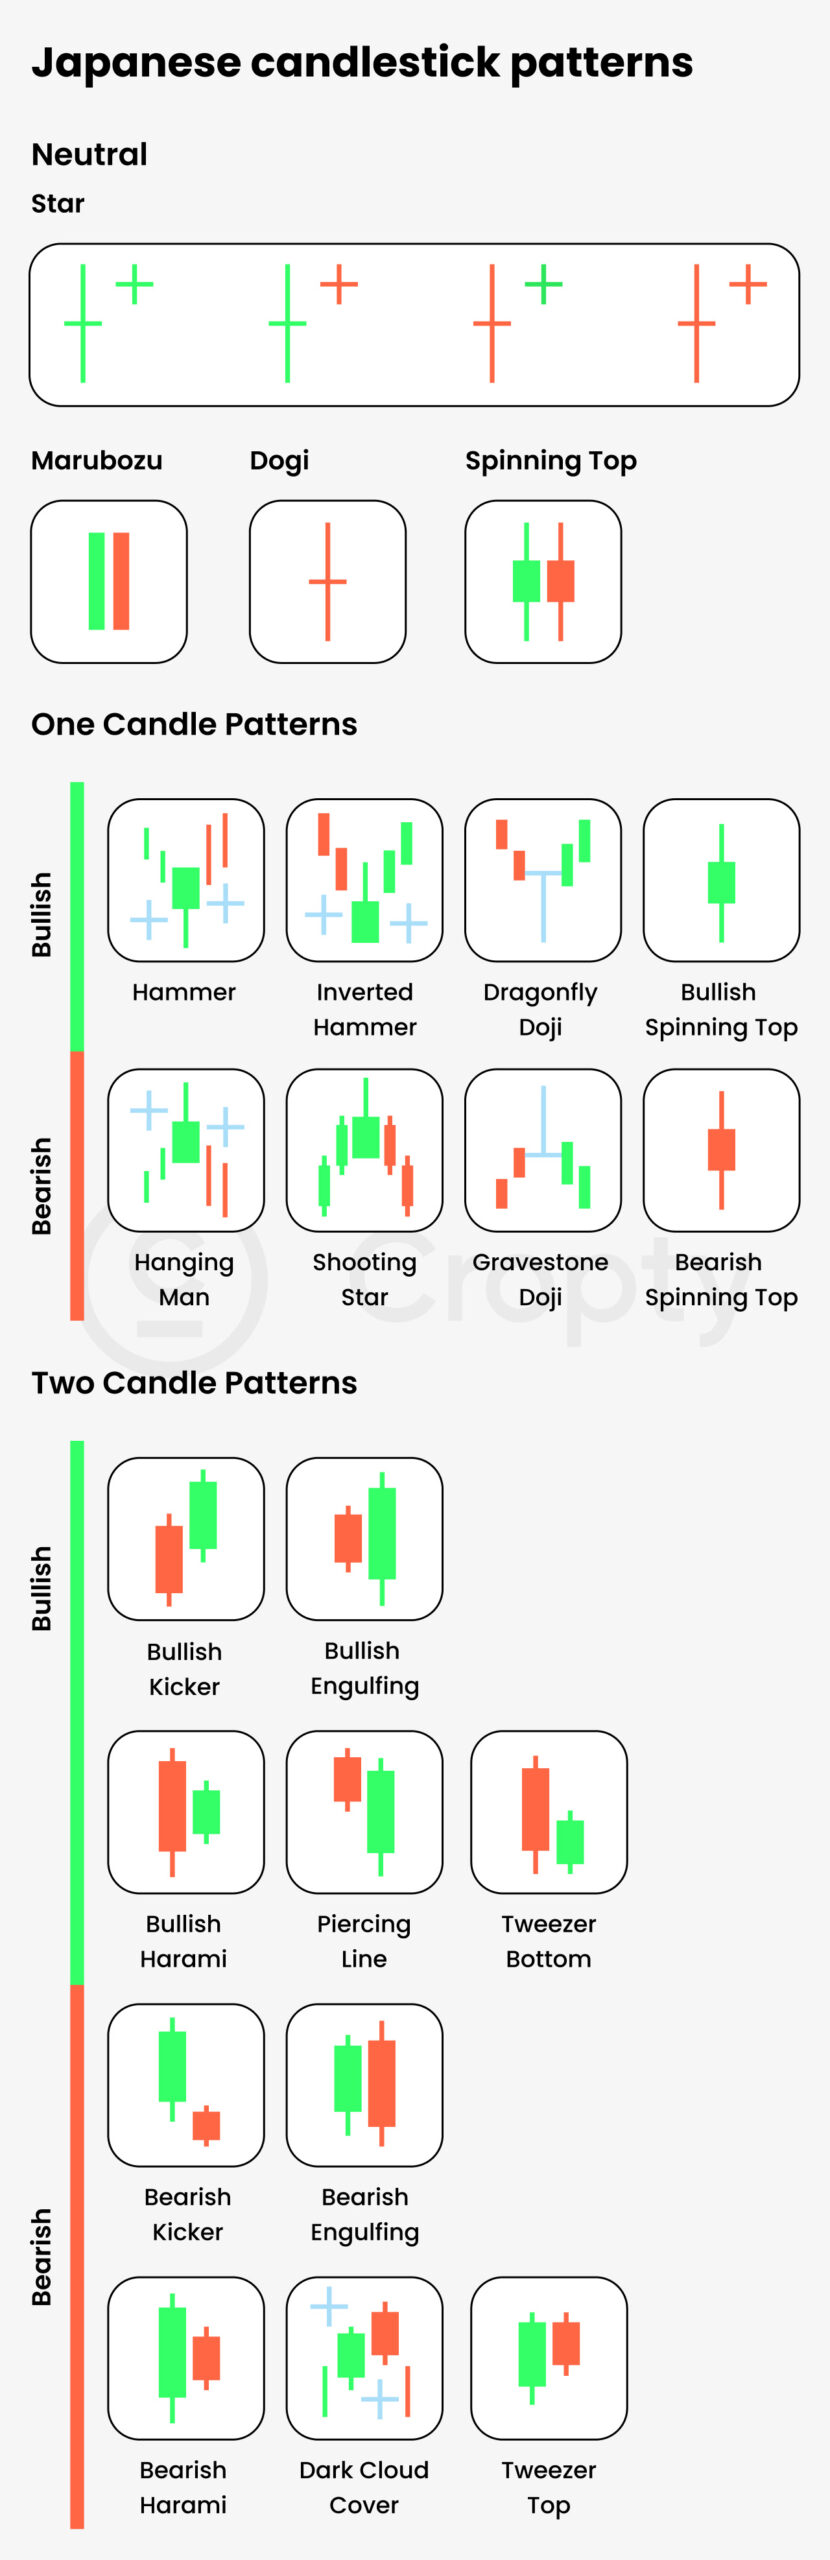
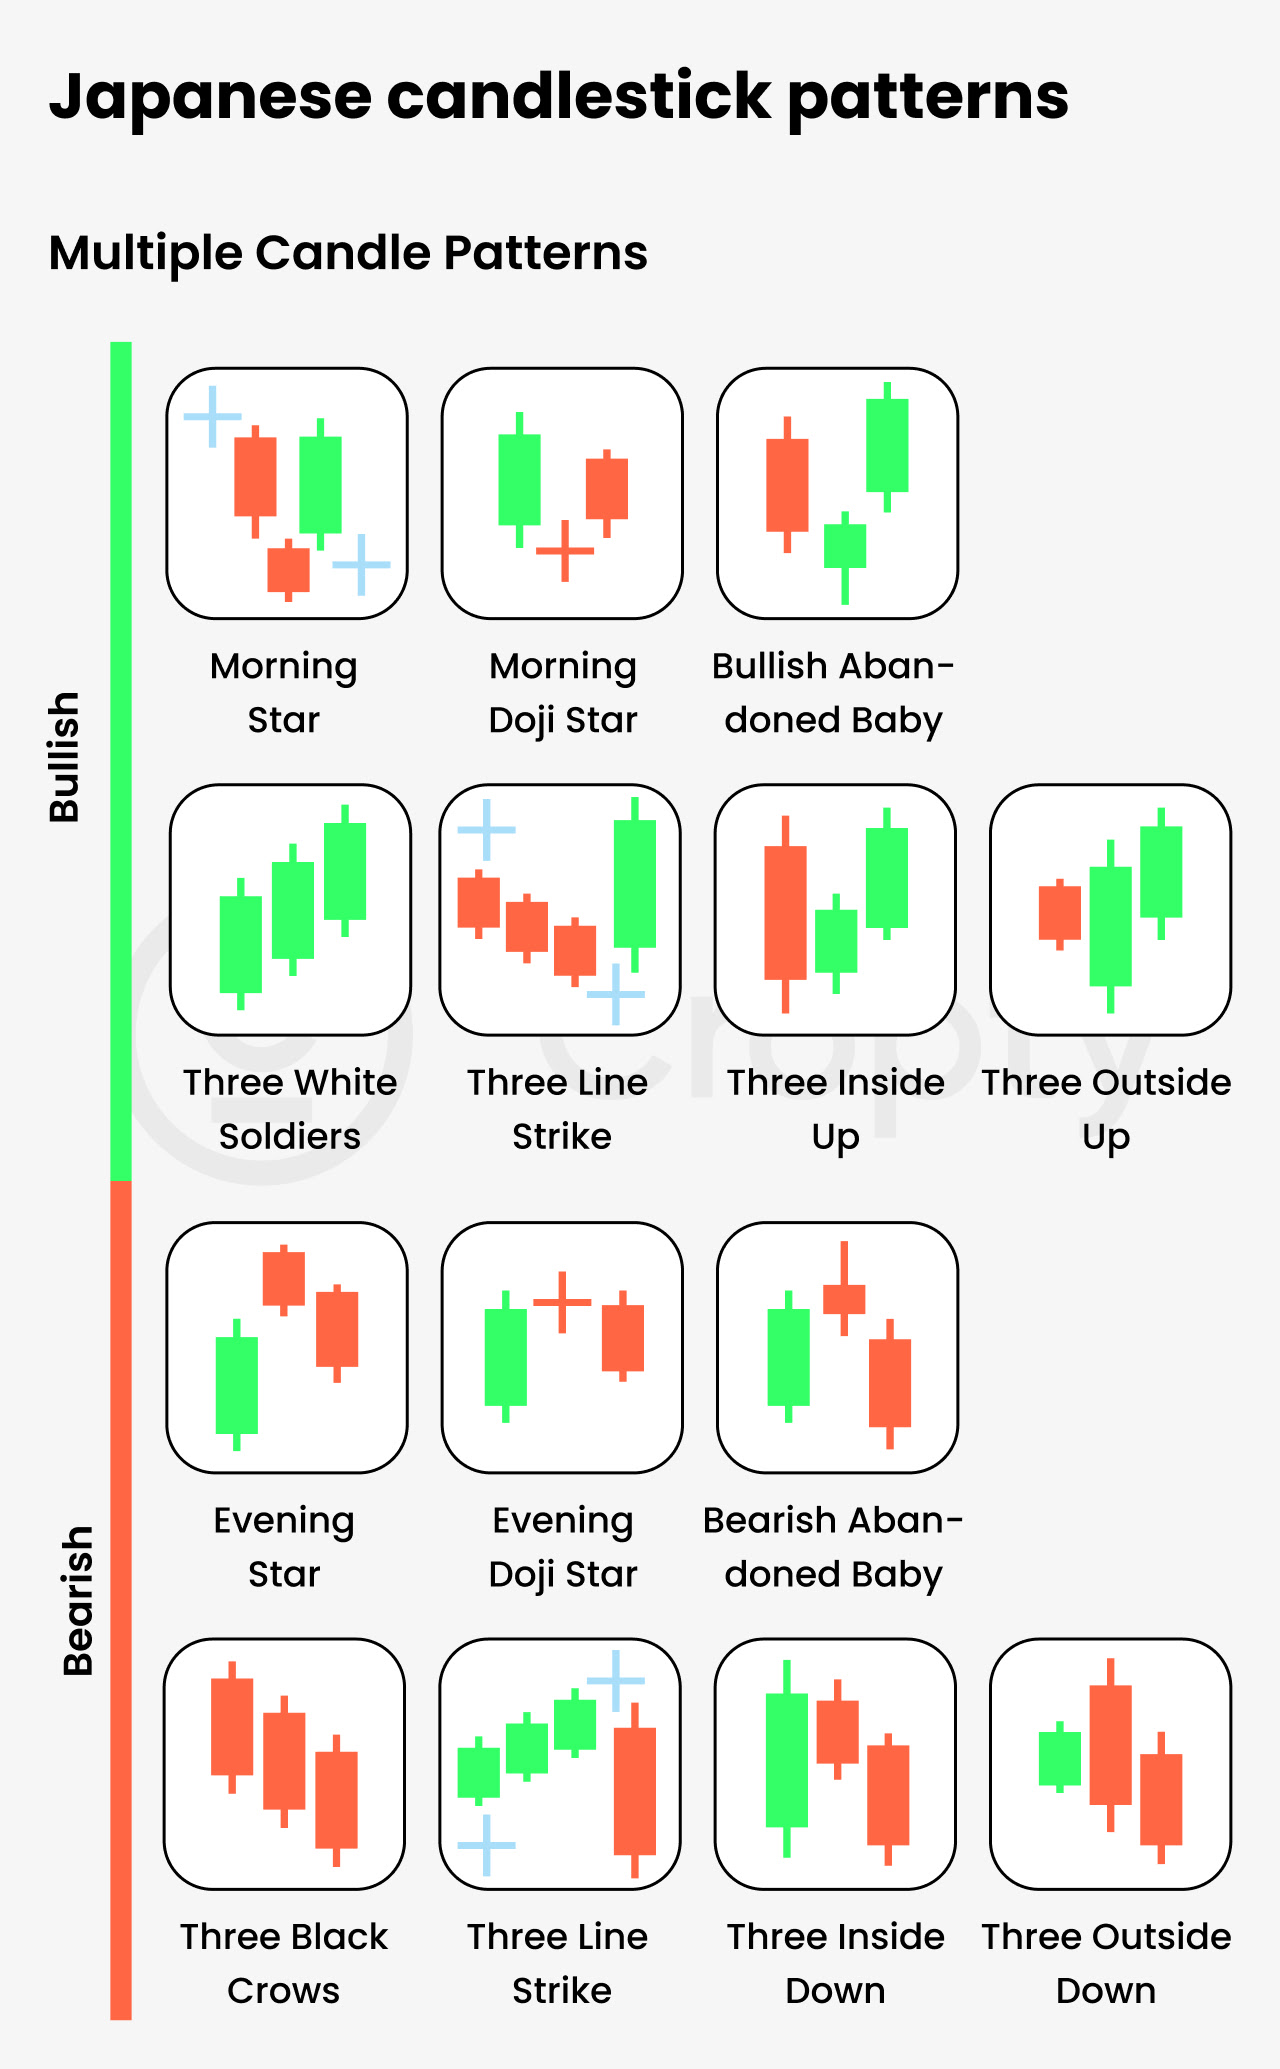
The majority of crypto charts are created on the candlestick pattern, as this visual representation is the easiest to read. The candlesticks on the chart represent different timeframes, i.e., trading periods. You can divide the candlestick chart into two bars:
- Body: The concentrated (thick) component of the bar shows the asset’s opening and closing prices.
- Wick: The less concentrated (thin) component of the bar represents the highest and lowest price points of a coin.
You will find that most crypto charts use the green candle as a bullish head to indicate the rise in price. Meanwhile, the red candle is drawn to show that the coin price is decreasing. If you see the candlestick with almost no body or long wicks, it means that neither buyer nor the seller is profiting from the market value.
Price Channels Crypto Chart Patterns
Price channels charts are designed by creating two ascending and two descending lines. These lines can either go against each other or move in a parallel line to show the highs and lows of the crypto value. The majority of crypto investors buy when the lines are touching the bottom of the chart and sell the coin when the lines move upward.
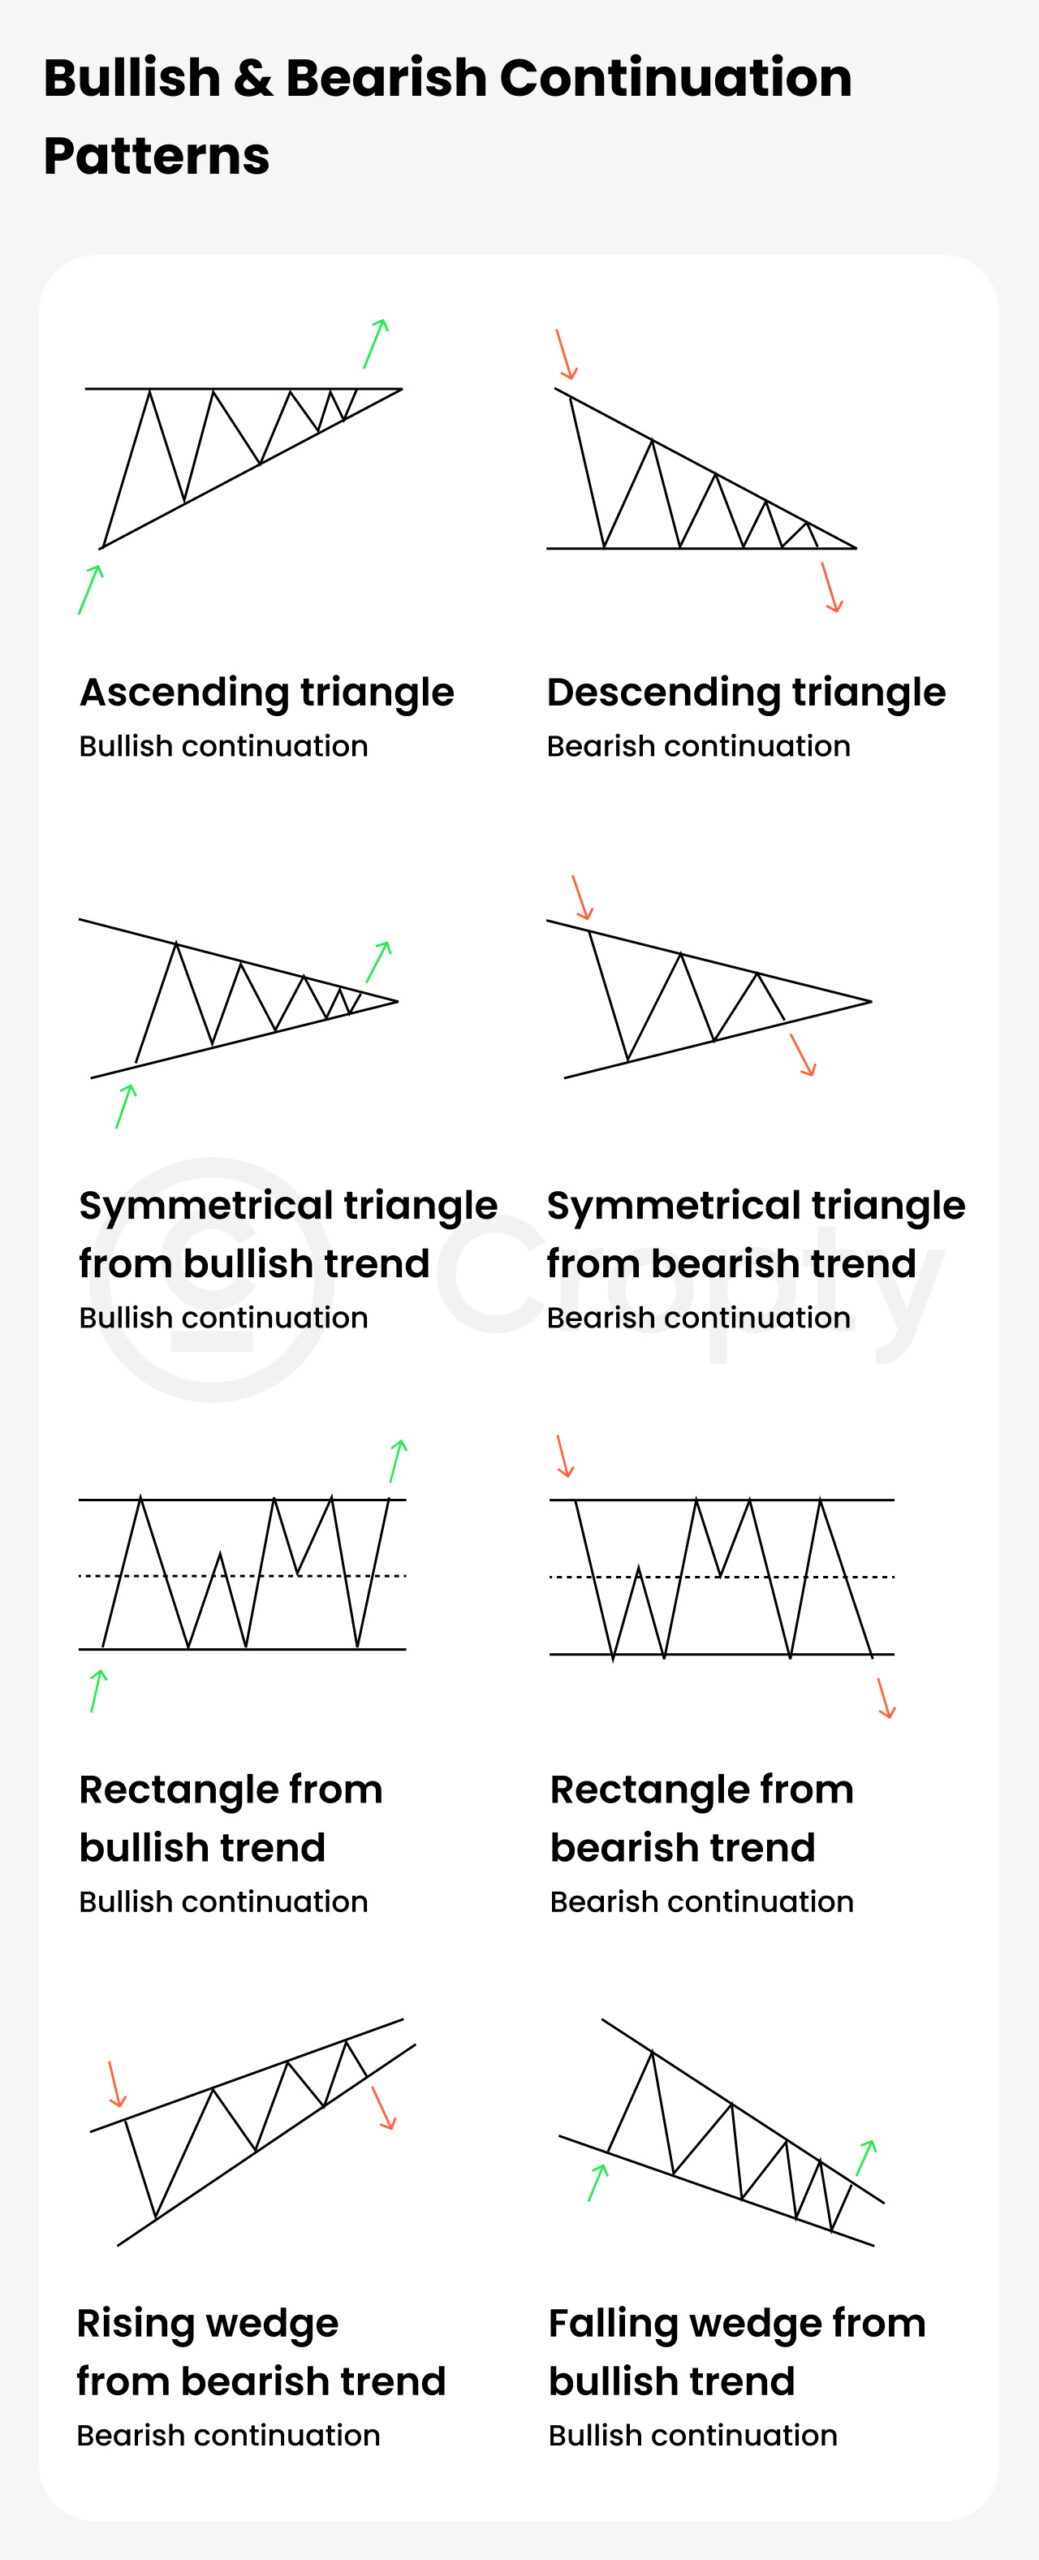
Ascending & Descending Triangle Crypto Chart Patterns
In the ascending and descending triangle chart, one horizontal trend line is connected with the second sloped one to create a triangle. This triangle shows the highs and lows of a coin’s price; the triangle’s peak is called the decision point. The decision point means that the coin is at its value.
Channel Down & Channel Up Crypto Chart Patterns
In the channel down & channel up crypto chart, diagonal parallel lines are drawn to represent the exchange range. One line shows the support point, and the other is to identify the resistance point. The upward or downward motion of the lines indicates whether the potential trend is reversal or it is expected to change in the future.
Basic Indicators in A Crypto Chart
When learning how to read crypto chart, you need to know the basic indicators that are commonly present. It will decrease your interpretation time and ensure you better understand the marketing trends.
Moving Averages Line
The moving averages (MA) line moves across the price chart to calculate how much prices are going up and down on a daily basis. The chart is designed for a specific time limit, and it provides useful insight into when you should invest. However, MA lines are not a good indicator of short-term market fluctuations.
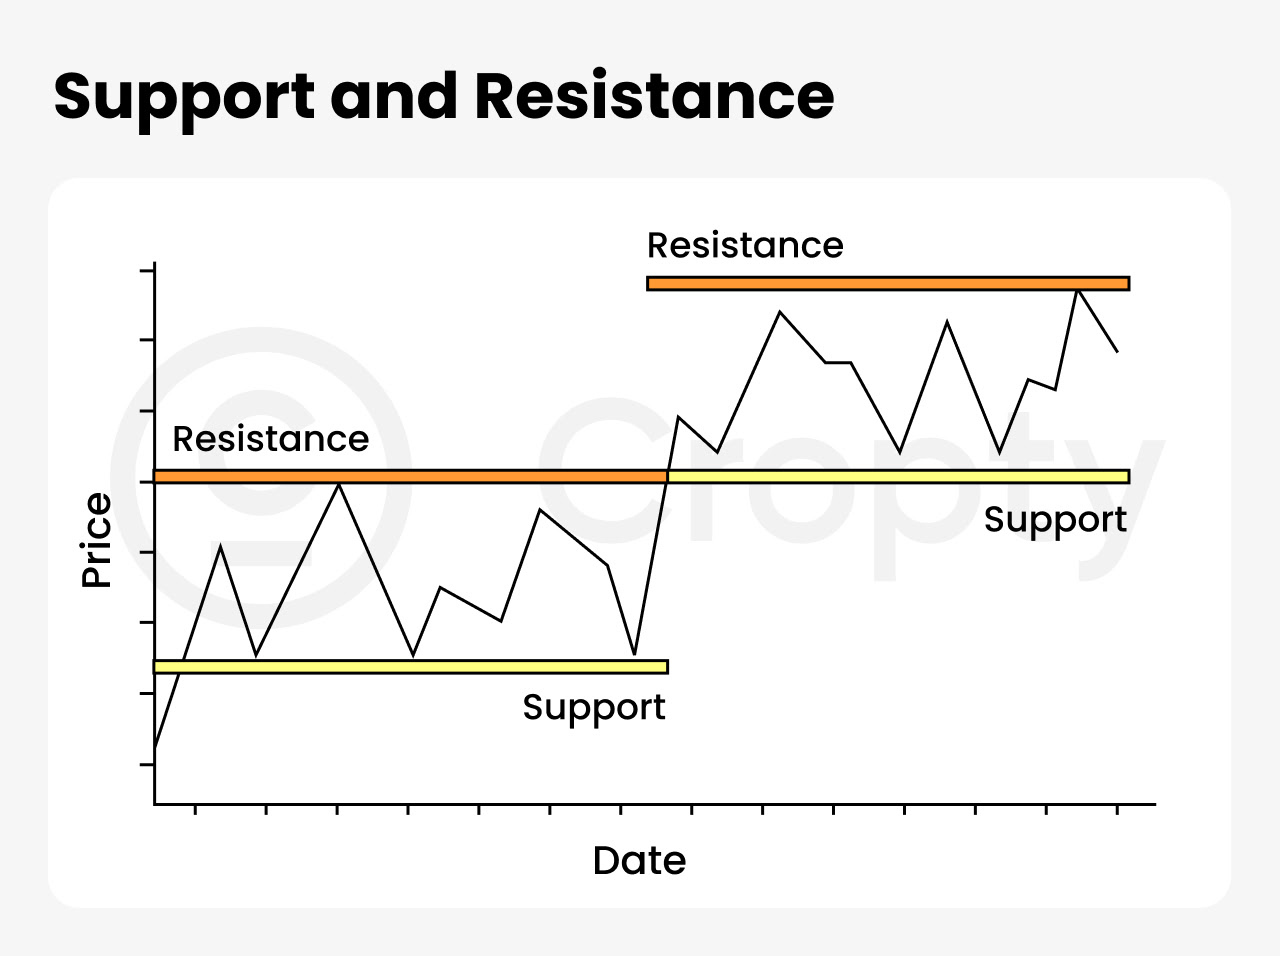
Support and Resistance Level
The support levels are price points that predict when crypto is expected to halt its upward or downward spiral. When the crypto is halted, it has the highest buying interest. Meanwhile, the resistance level represents the best point to sell the coin.
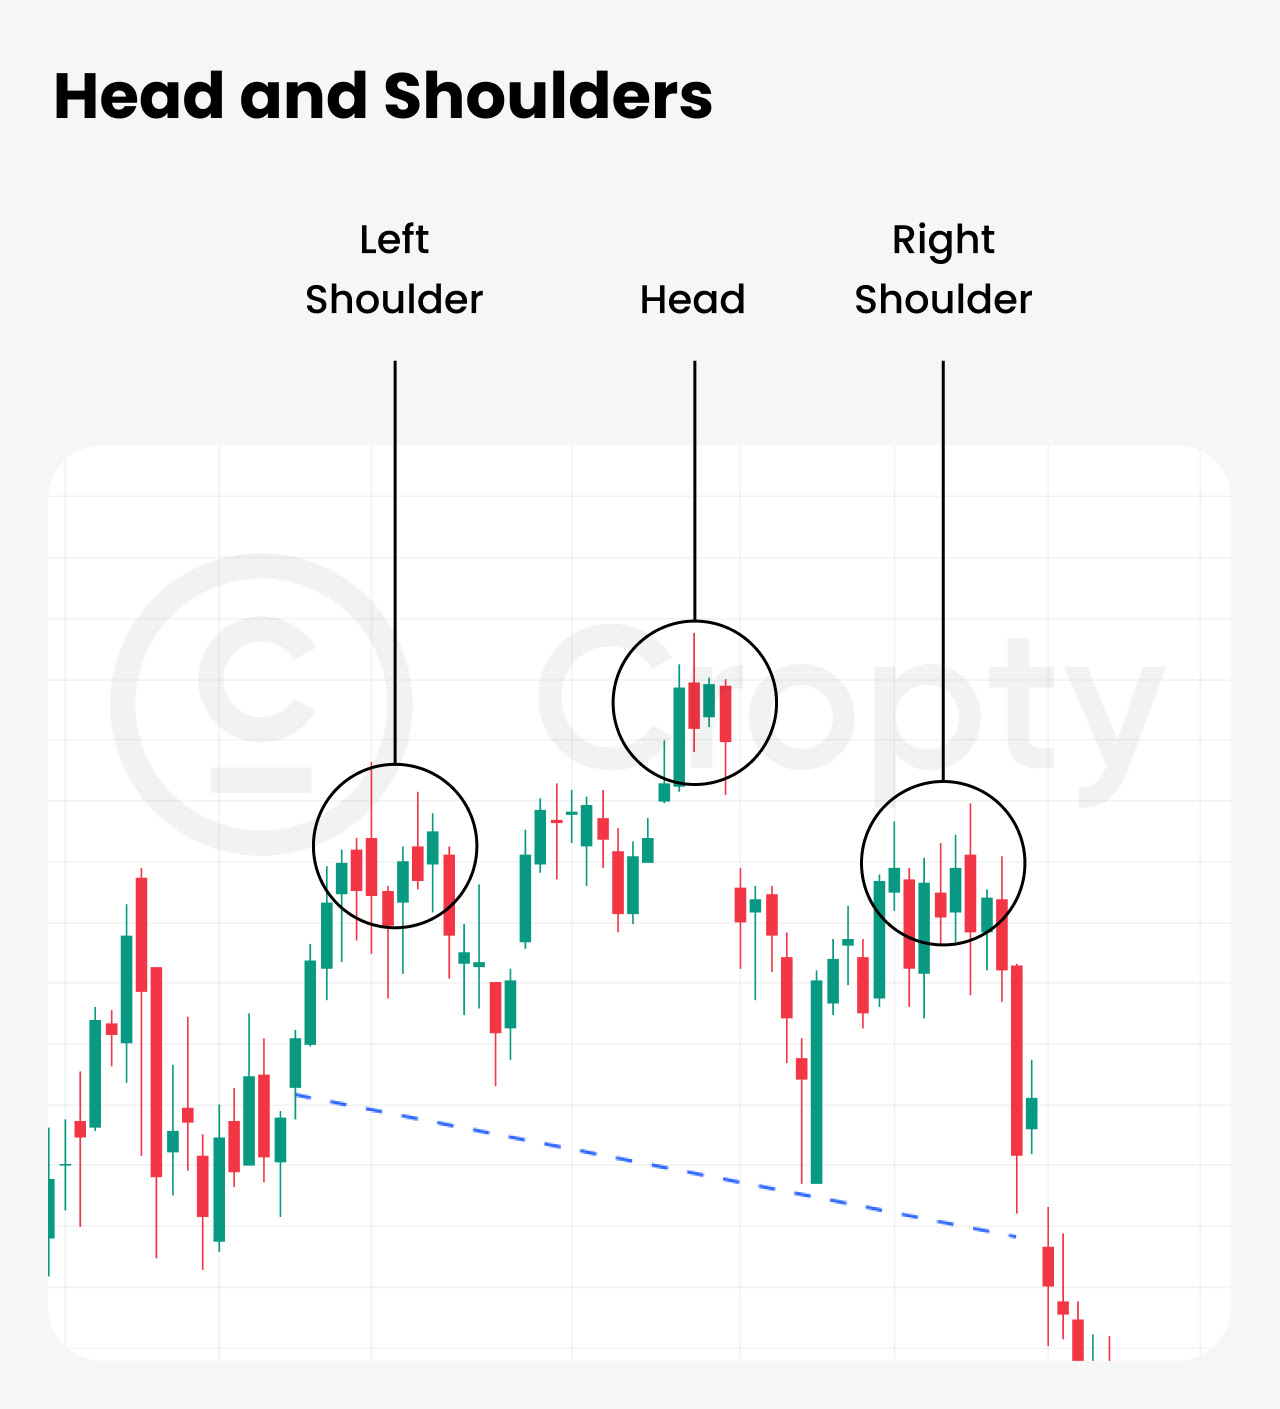
Head and Shoulders
Head and Shoulders indicators can appear on top or at the bottom of the chart. If it is a bullish head and shoulder, your crypto coin’s price is about to rise. On the other hand, the bearish head and shoulder show a decline in your coin’s value.
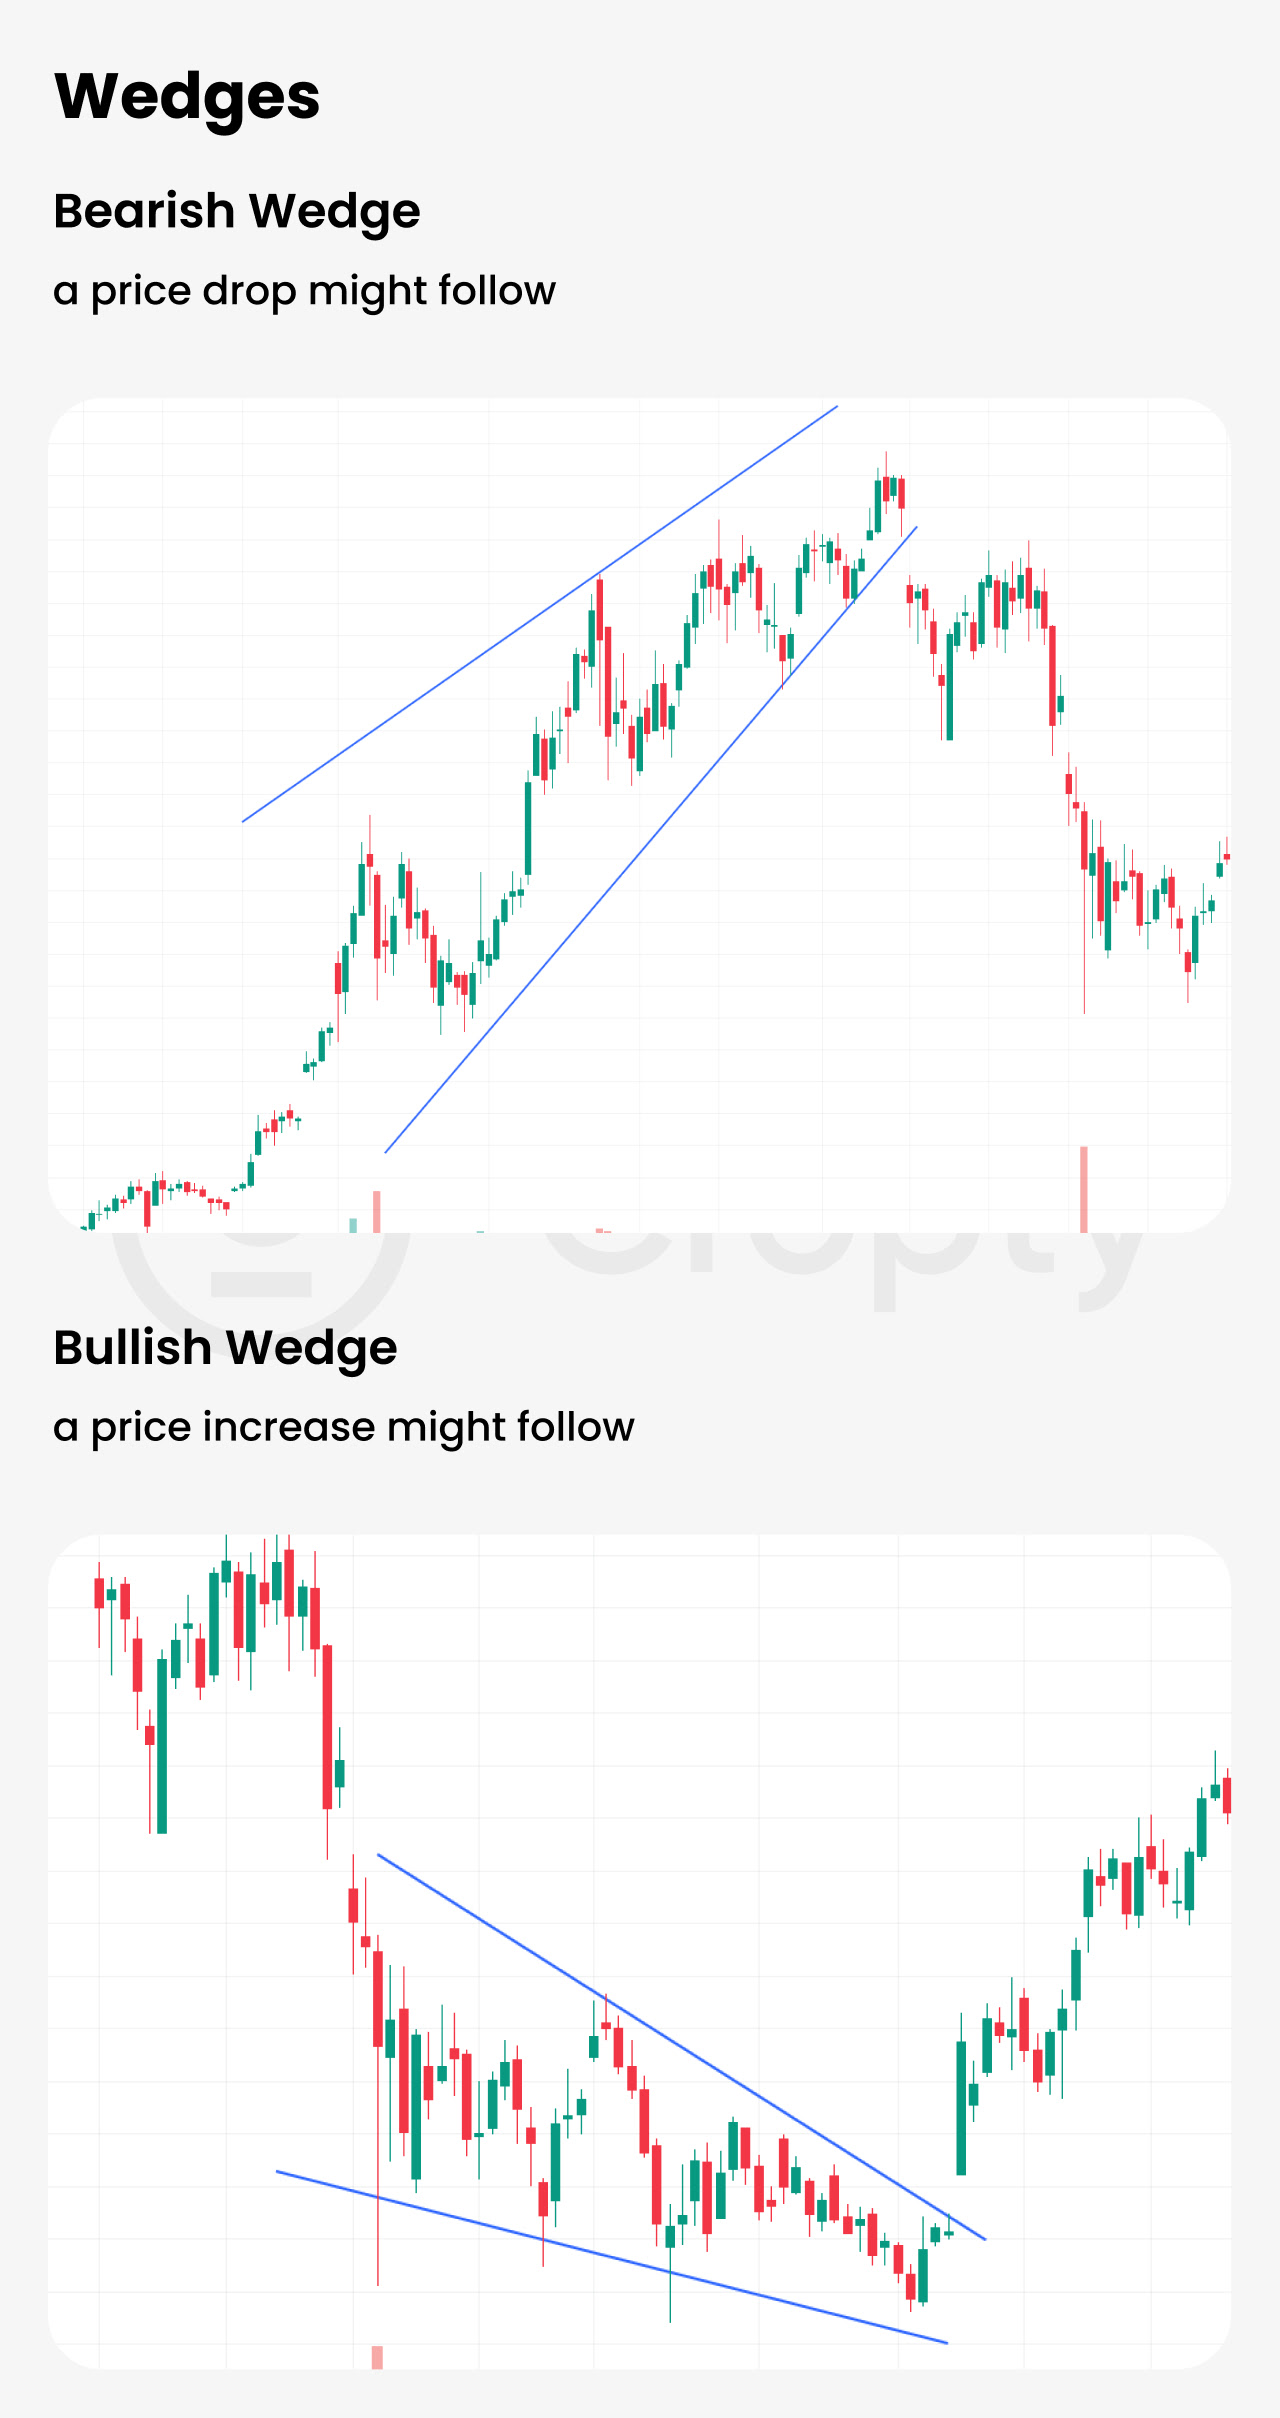
Wedges
A wedge in the crypto chart demonstrates that a coin or market value is losing traction. In simple words, cryptocurrency is losing its growth momentum. A bullish wedge represents that the crypto market is predicted to improve. In comparison, a bearish wedge indicates a cryptocurrency peak and subsequent sell-off.
How To Read Cryptocurrency Charts?
Cryptocurrency charts are a great way to track the movements of different coins and tokens. However, if you are wondering ‘How to read Bitcoin charts’ or ‘How to read Ethereum charts,’ the answer is not necessarily straightforward. While all charts have similar features and use technical analysis, each coin has unique features.
These charts use a variety of technical indicators to give a detailed view of market trends. The most commonly used indicators include moving averages, Bollinger Bands, Fibonacci levels, and relative strength index. These indicators identify support/resistance levels, trend lines, and other aspects of market movements.
It should also be noted that different exchanges may have slightly different charting tools and indicators, so it is important to get familiar with the ones used on your preferred exchange. Additionally, some coins may have different indicators than others, so it is important to understand the features of each indicator.
The most basic type of cryptocurrency chart is the line chart, which displays continuous data over a set period. Line charts are particularly useful for viewing trend movements, as they clearly show the direction and magnitude of any price movements.
Market Depth Chart is a useful tool for traders who want to see the volume of orders placed at each price level. This chart is an important tool for traders, as it can be used to identify buy and sell signals.
In addition to the chart types mentioned above, various other options are available such as bar charts, volume charts, and technical analysis charts. These chart types can be used to gain valuable insights into the movements of cryptocurrency prices.
How to Analyze Bitcoin Market?
There are a few different ways to analyze the bitcoin market. Let’s take a look at the top 3 effective methods to analyze the market.
1. Candle Stick Chart
Candlestick charts are a powerful tool for analyzing the bitcoin market. They provide an easy-to-understand visual representation of the price action and order flow over time.
When analyzing a candlestick chart, it is important to understand how each bar is constructed. A single candle represents one trading period composed of four parts – the open, high, low, and close prices. The body of a candlestick shows the range between the opening and closing prices of that period, while the ‘wick’ portion shows the highest and lowest traded prices during that period.
In addition to these four data points, they can also include indicators such as volume and moving averages.
By studying the patterns in a candlestick chart, traders can identify potential areas of support and resistance for price action and market trends. For example, long green candles indicate strong buying pressure during that period and bullish sentiment in the market overall. Similarly, long red candles may signify bearish sentiment or an overly aggressive sell-off.
Additionally, dojis (when open and closed prices are nearly equal) may signal a possible reversal or consolidation point in the market.
2. Bollinger Bands
Bollinger Bands can be used in conjunction with other indicators to help traders gain a better understanding of the Bitcoin market. For example, they may be used to identify overbought or oversold conditions in the market. Combined with other signals, such as price action, volume, and moving averages, they can provide an effective tool for spotting potential trading opportunities.
They are also relatively easy to interpret. By noting when prices move outside the bands and confirming this movement with additional indicators, traders can enter trades with greater confidence than relying solely on one indicator alone.
Furthermore, traders can better understand the market volatility by overlapping several periods of Bollinger Bands onto a single chart. This helps them determine when to enter or exit trades, allowing them to maximize their profit potential.
Moreover, they can also facilitate in identifying support and resistance levels in the Bitcoin market. When prices touch one of the bands, this could indicate a change in price direction and provide an opportunity for traders to enter a new position.
By combining other signals with Bollinger Bands, traders can develop their trading strategies and make more informed decisions about the Bitcoin market.
3. Relative Strength Index
The Relative Strength Index (RSI) is an important tool for traders to understand the market behavior of Bitcoin. It helps traders identify overbought and oversold conditions, which can signal entry or exit points for trading. It is a momentum oscillator that analyzes the degree of recent losses and gains to measure the speed and change of price movements of a security.
To calculate the RSI, first, take the average gain of up periods in the given lookback period and divide it by the average loss of down periods. Then, take this value and calculate its relative strength by dividing it by one plus itself. This will give you your RSI value which ranges from 0 to 100.
A low reading of the RSI indicates that Bitcoin is oversold and could signal traders to buy. Conversely, a high reading of the RSI indicates that Bitcoin is overbought and could signal traders to sell. It is important to note that these signals should not be taken as absolute truths but as indications of potential opportunities.
Along with signaling entry and exit points, the RSI can also indicate whether current trends are likely to continue or reverse. If the market has been in an uptrend for some time and the RSI value is below 30, it may suggest that there is potential for a reversal. Similarly, if the market has been in a downtrend for some time and the RSI value is above 70, it may suggest that there is potential for a reversal.
It is important to remember that the RSI is only one indicator and should be combined with other technical analysis tools to get a more comprehensive view of the market.
How to Tell If a Cryptocurrency Will Rise?
Cryptocurrency is a highly volatile asset class, and predicting its future value fluctuations is incredibly difficult. Despite this, certain criteria can help to identify if a particular cryptocurrency may rise in value over the long term.
Leverage the Power of a Strong Team
The first indicator to look for when determining whether a cryptocurrency will rise is the team behind it. A strong development team with experience and a good track record of delivering on promised features can be seen as an indication of potential success.
Correspondingly, take note of the level of community involvement; high levels of engagement from users suggest a positive sentiment toward the project and, therefore, a greater potential upside.
Be Informed of the Technicalities
The second indicator to consider is the technology underpinning the coin; it’s essential to research the technical aspects of a project. You should determine how much use it has and how attractive it is to developers; these factors will ultimately decide the success or failure of most cryptocurrencies.
Also, you should consider whether the coin utilizes an existing blockchain or if it is its platform. Coins built on their platform are often more ambitious projects and can have more potential to disrupt existing markets in the future.
Stay Updated on Crypto Market Trends
Finally, take note of news related to cryptocurrency; any major announcements, such as partnerships with businesses or governments, can suggest that a rise in value may be imminent. Look out for changes in trading volume, liquidity levels, and overall market sentiment towards the coin; all these elements can help determine investment potential over time.
Wrapping Up
Using these tools and indicators, cryptocurrency traders can analyze markets more effectively and make informed trading decisions that maximize their profits. However, traders need to remember that no strategy guarantees success in the crypto markets, so proper risk management should always be practiced when trading Bitcoin or any other digital asset.
FAQs
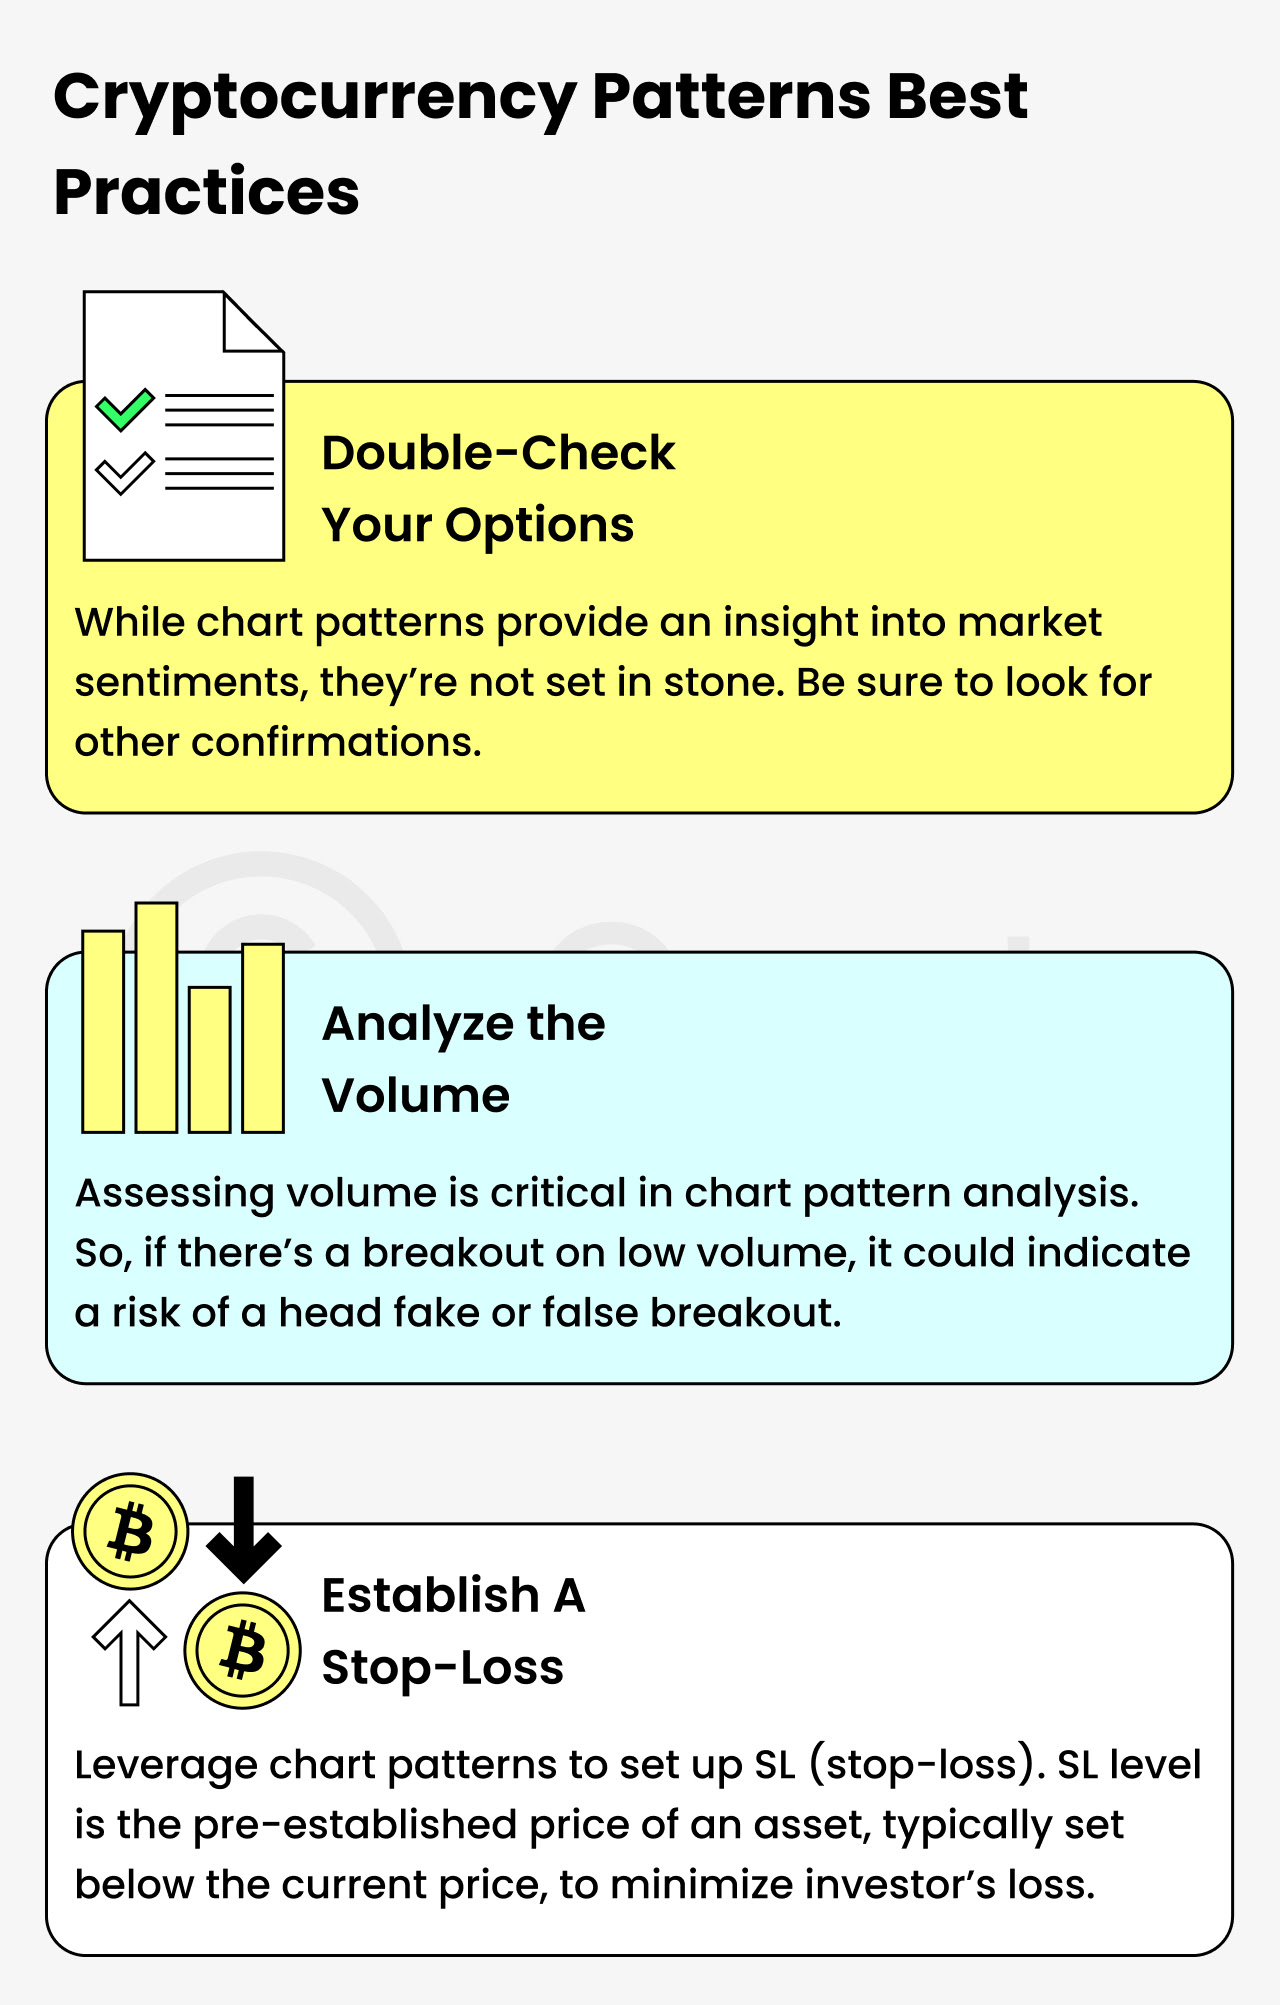
Do Chart Patterns Work For Crypto?
Chart patterns can be useful for analyzing the crypto market, as they provide insight into potential price movements. However, it is important to remember that chart patterns are not foolproof and should not be used as the sole basis for trading decisions.
What Is The Best Charting For Crypto?
When choosing a charting tool for trading cryptocurrencies, look for one with reliable data sources and customization options, so you can tailor your analysis to your preferences. To enumerate, consider how user-friendly the platform is – if you’re new to crypto trading, choosing a service that offers tutorials and guides might be beneficial.
What Coin Will Explode In 2023?
Dash 2 Trade, Ethereum, and Solana are all likely to explode in value in 2023. These are the three most popular Crypto coins and they are all likely to see significant increases in value over the next few years. Each of these coins has its own unique features and benefits, so it is important to do your research and understand the potential risks before investing.
How to Analyze A Crypto Coin Before Buying?
To analyze a crypto coin before buying, check its circulation supply (how much of that crypto coin is available in the market). Then check how much of the cryptocurrency will be left after the tokens are unlocked and distributed. At last, you should find how much a platform will allow you to mint (create new tokens) a coin.
What Is A Bullish And Bearish Flag?
A bullish flag pattern shows that a cryptocurrency is experiencing a high rise in price. In addition, the bearish flag pattern indicates that a cryptocurrency value is moving downward.